Mdhc Dark logo transparent

MATTHEW COLES

INFOGRAPHICS DESIGN

Contents menu icon large
Dark mode icon largeDay mode icon large
instagram dark iconDribbble logo largeFacebook icon largeTwitter logo darkLinkedIn dark icon

INFOGRAPHIC DESIGN LONDON

Welcome to infographic designer Matthew Coles website.

Make your

infographic

today!

Infographics are a powerful way to communicate complex information in a concise and visually compelling way. Whether you're looking to explain a process, showcase data, or tell a story, infographics can help you get your message across in a way that's easy to understand and engaging for your audience.

They help Increase Engagement: Infographics are more engaging than pure traditional text-based content. They use visual elements like charts, graphs, and illustrations to make information more interesting and easier to understand. This can help businesses capture the attention of their audience and keep them engaged for longer periods of time.

They Improve Information Retention: Infographics are also more effective at helping people remember information. Studies have shown that people remember 80% of what they see and do, compared to just 20% of what they read. By presenting information in a visual format, businesses can improve information retention and ensure that their message is more likely to stick with their audience.

They Increase Social Media Shares: Infographics are highly shareable on social media. People are more likely to share content that is visually appealing and easy to understand. This can help businesses increase their reach and get their message in front of a larger audience. Additionally, infographics can help businesses establish themselves as thought leaders in their industry by providing valuable information in a visually compelling way.
get a quote today
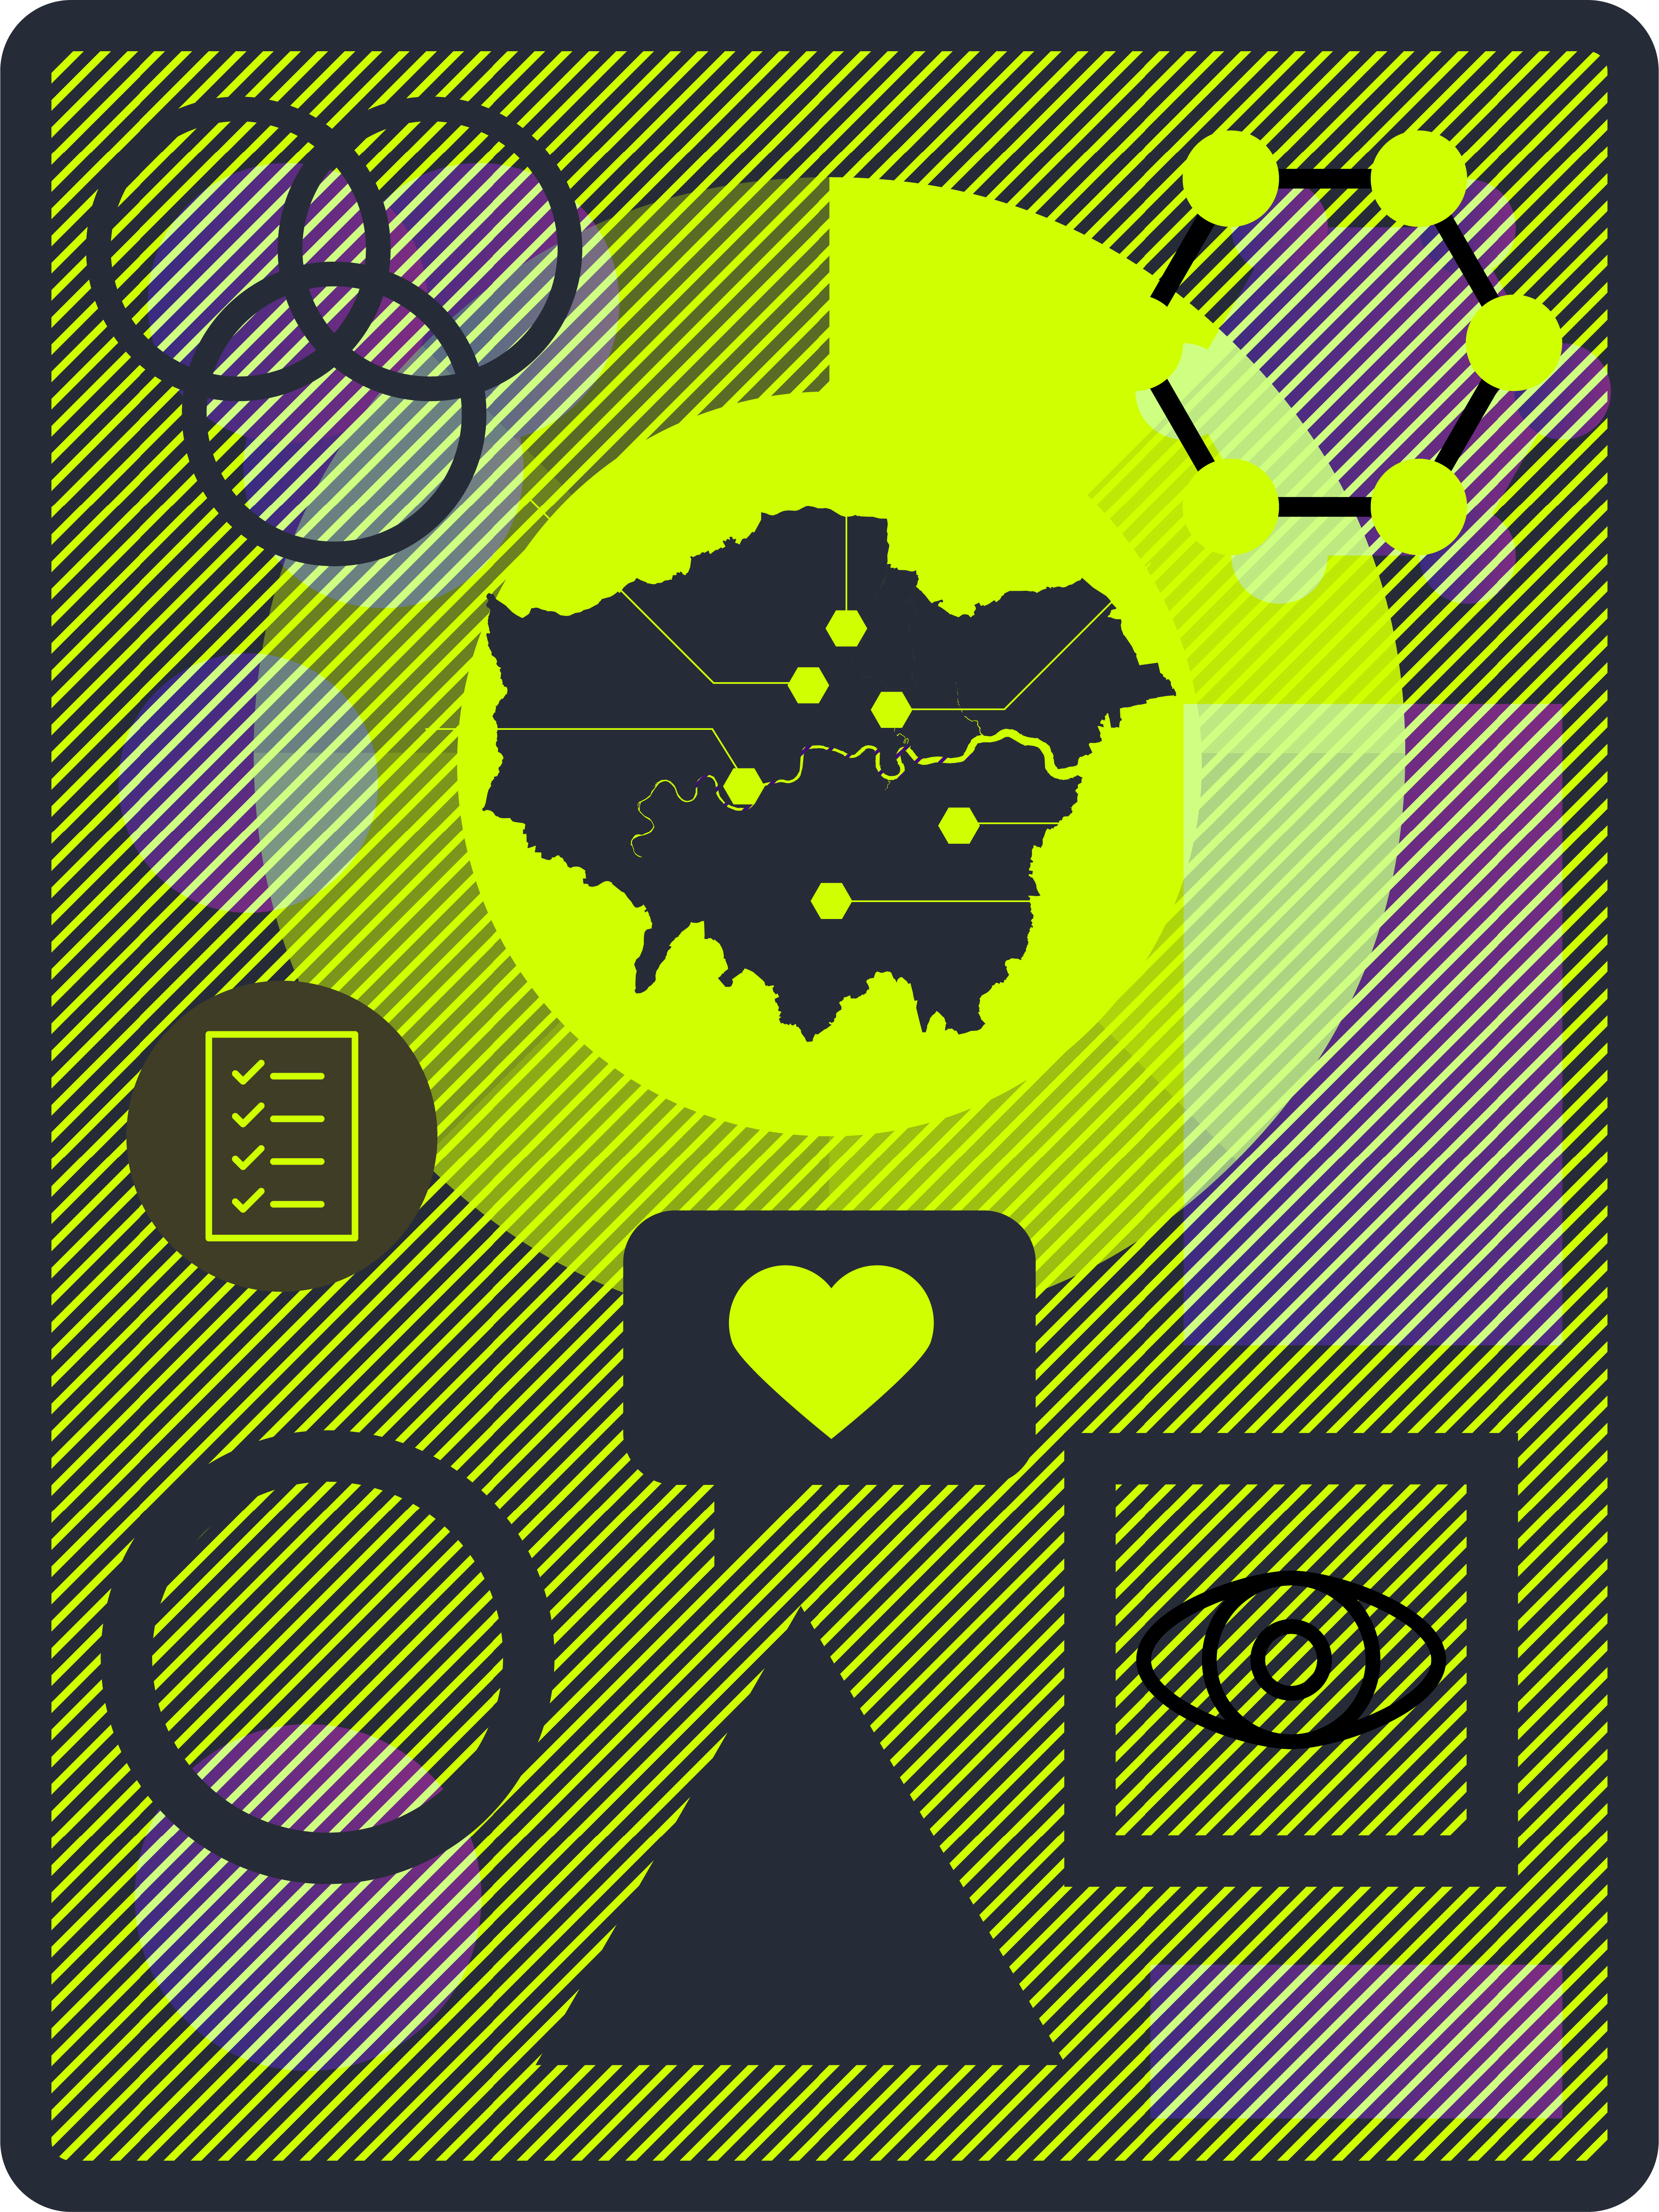
Infographic designer matthew coles london illustrationInfographic designer matthew coles london illustration mobile version

WHAT INFOGRAPHIC DO YOU REQUIRE?

Infographics are a valuable tool for businesses that want to communicate complex information in a way that is engaging, memorable, and shareable. By using infographics, businesses can increase engagement, improve information retention, and increase their reach on both social media and in traditional media outlets, online and in print.

Get in touch

TYPES OF INFOGRAPHIC

Timeline infographics

Process infographics

Informational infographics

Geographical infographics

CV infographic

List infographic

Data visualisation infographic

Comparison infographic

Flowchart infographic

Interactive infographic

Statistical infographics

Hierarchy infographic

Are you ready to create your own infographic today? 
Follow these simple steps to get started...

HOW WE DO IT INFOGRAPHIC PROCESS
STEP BY STEP

STEP ONE

RESEARCH

research icon number
The first step in creating an infographic is to define your message and tell your story. What do you want to communicate? Who is your audience? What's the main point you want to make? Once you have a clear idea of what you want to say, who you want to say it you, you can start thinking about how to say it. At this point we like to confirm the format and outputs for the project. Does the final design need to be consistent with the client's brand guidelines or is something more unique and bespoke required.

STEP TWO

BRIEF

Research icon
Infographics are all about data, so the next step is to gather your information. This could be anything from sales figures to survey results to demographic data. Make sure you have all the data you need before you start designing your infographic. This may involve conducting research, collecting data from the client, or using existing data sources. Once you have the data, analyze it to identify key insights and trends.

STEP THREE

STORYBOARD

STORYBOARD icon with number
Infographics rely heavily on visual elements such as charts, graphs, icons, and illustrations. Choose the right visual elements that will best represent the data and convey the message. The easiest way we find to do this is to produce a wireframe to map content and help give a visual representation of your story. Once this is signed off we move onto the design and layout of the infographic.

STEP FOUR

DESIGN

Design infographic icon
Before finalizing the infographic, review it thoroughly to ensure that the data is accurate, the message is clear, and the design is visually appealing.
Revise the infographic as needed based on feedback from the client or other stakeholders, all our prices include 3 rounds of amends and final approved artwork files.

STEP FIVE

DISTRIBUTE

To the moon distribute icon with number
Decide where you want to launch your infographic. You can post it on your website, share it on social media, or submit it to infographic directories. Choose a platform that is relevant to your target audience and that will help you reach the widest possible audience.
Smaller place holder

01

02

STEP TWO

BRIEF

03

STEP THREE

STORYBOARD

04

STEP FOUR

DESIGN

05

STEP FIVE

DISTRIBUTE

CURRENT AND PREVIOUS CLIENTS:

i newspaper logo darkRenaix logo darkupwork logo darkISD logo dark transparentLSE logo dark

INTERESTING QUOTE BLOCK

Not all charts are born equal design agencies are built equal: some rise above others for their level of skill and experience.

More information

LATEST PROJECTS

TYPES OF CHART

Scatter Plot Chart

Treemap Chart

Venn Diagram

Bar Chart

Bubble Chart

Column Chart

Donut Chart

Gantt Chart

Line Chart

Maps

Pie Chart

MDHC dark outline logoMdhc Dark logo transparent
CONTACT 
MATTHEW COLES
INFOGRAPHIC DESIGNER
Abingdon
oxfordshire
Ox14 5rf
CALL +44 7766661054
HELLO@MATTHEWCOLES.COM
COPYRIGHT MATTHEW COLES 2023 ©